Distribution of the first annual iPLEX newsletter began on April 24, 2013. This 36-page publication highlights planetary research at UCLA undertaken by scientists from the Earth & Space Sciences, Astronomy, and Atmospheric & Oceanic Science departments, including the recent discovery of ice on Mercury, weather on Titan, and the Dawn spacecraft at Vesta. Also included is an update on the UCLA Meteorite Museum and a Q&A with Ashwin Vasavada, the deputy project scientist for the Mars Science Laboratory mission. Hard copies of the newsletter are available free of charge in the iPLEX office (Slichter 3839). An electronic version of the iPLEX newsletter is available for download from this site as a PDF document, which can be viewed in all major pdf viewers including iBooks on Apple devices. The e-version of the newsletter includes links to videos and websites for more information.
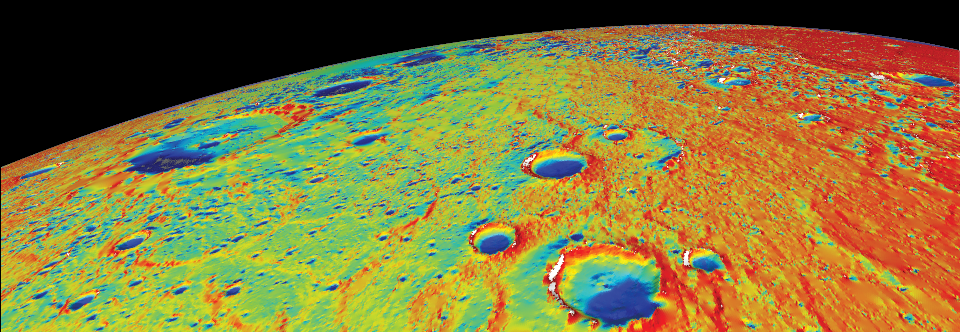
A thermal map of the north polar region of Mercury. The blue areas denote permanently shadowed regions cold enough for water ice to be stable on or below the surface.
Planetary scientists have identified water ice and anomalously dark deposits within permanently shadowed regions at Mercury’s north pole. Using data collected by NASA’s MESSENGER spacecraft, a UCLA team crafted the first accurate thermal model of the solar system’s innermost planet that successfully pinpoints extremely cold regions where ice has been found on or below the surface. They conclude that the newly discovered black deposits are a thin dark crust of residual organic material brought to the planet over the past several million years by water-rich asteroid and comet impacts.
Understanding how water ice has been preserved on Mercury and where it came from may help scientists determine the conditions necessary for sustaining life on other planets.
[EXPAND Read More]
This research, one of three MESSENGER papers published online today and in an upcoming print edition of Science, sheds light on the longstanding issue of ice on Mercury. The sun-scorched planet is now revealed to have extensive water ice deposits at its poles by several independent lines of evidence.
In the early 1990s, scientists were surprised to find that areas near Mercury’s poles were unusually bright when observed with radar from Earth, a potential indication that ice might be present.
Lead author David Paige, a self-described “professional ice finder,” has studied the poles of planetary bodies in the solar system from Mercury to Pluto.
“Mercury is the innermost planet in the solar system and arguably it’s among the least explored,” said Paige, a professor of Earth and space sciences at UCLA. “The surface of Mercury exhibits the most extreme range of temperatures of any body we know of in the solar system.”
Within a single polar crater on Mercury there are places that reach the oven-like temperature of 500 degrees Fahrenheit within sight of areas cold enough to freeze and preserve water ice for billions of years. These “natural freezers” exist within shadowed areas inside polar crater rims that never experience direct sunlight due to the low angle of the Sun at such high latitudes, Paige said.
Paige was able to use the first detailed topographic map of Mercury’s north polar region produced by MESSENGER to generate an accurate thermal model of the pole. His calculations of Mercury’s subsurface temperatures are a near perfect match to Earth-based radar observations and surface brightness measurements made by the Mercury Laser Altimeter (MLA) instrument onboard the orbiting spacecraft.
Where his temperature model predicts water ice should be stable on the surface, the MLA nearly always measures unusually bright patches, indicative of surface ice deposits. In places where it is too warm for surface ice but cold enough for ice to exist beneath the surface, the MLA sees unusually dark material.
“This stuff we find covering the ice is darker than the rest of Mercury, which is already a really dark planet. That’s amazing,” said Paige. “At the very least it means there is something out of the ordinary going on inside these permanently shadowed areas where the ice has accumulated.”
The mysterious dark substance likely arrived on Mercury as part of comets and asteroids that periodically crash into the planet, bringing water ice and a diverse cocktail of organic material, Paige said. In the searing daytime heat of Mercury, the only place water and organics can survive is within permanently shadowed craters.
But only in the very coldest areas of the permanently shadowed regions can water ice exist on the surface. In the warmer shadowed areas, the top layers of ice begin to evaporate away into space, leaving behind a layer of hardy organic molecules that are stable at higher temperatures and turn black over time when exposed at the surface. Once the dark layer is thick enough, it protects the ice underneath, allowing a subsurface ice deposit to survive.
“There are areas on the surface where it is too hot for ice to exist, but radar data from Earth show something bright reflecting from these areas so we’re pretty sure that there’s water ice buried underneath,” said co-author Dr. Matthew Siegler, a JPL researcher and recent UCLA alumnus. “You need some kind of insulating layer to keep that heat from getting down to the ice.”
The presence of bright ice and dark organics on Mercury’s surface presents a mystery for MESSENGER researchers. Large comets and asteroids periodically impact Mercury, covering a huge swath of the planet in a layer of dirt and dust and adding yet another crater to the airless planet’s scarred landscape. For the water ice and black organic layers to remain exposed on Mercury’s ancient surface, the deposits must have formed recently in Mercury’s geological history or must be maintained by new water brought to Mercury by smaller, more frequent impacts.
“Billions of years ago, the Earth acquired a layer of water and other volatile material that formed atmospheres, oceans, and even the first organic molecules that started life,” said Paige. “Understanding the origin of that material is a very important problem and is essential to finding out about the potential habitability of planetary systems around other stars.”
Other UCLA co-authors include Ellen Harju, a graduate student in the department of Earth and space sciences. Paige’s study was published alongside two other MESSENGER papers with colleagues David Lawrence and Greg Neumann as the lead authors. All three research discoveries were showcased today in a press conference on NASA TV.
Launched in 2004, MESSENGER became the first spacecraft to orbit Mercury in March of 2011. Previously, humankind’s closest glimpse of the innermost planet in the solar system was during three flybys of Mercury by the Mariner 10 spacecraft in 1974–75. The name MESSENGER, short for MErcury Surface, Space ENvironment, GEochemistry and Ranging, was chosen to evoke the Greco-Roman messenger deity Mercury, a god of trade, merchants, and travel.
[/EXPAND]
Professor David Paige explains how a thermal model at UCLA helped determine where water ice is found on Mercury.
Professor David Paige discusses how water ice may have arrived on Mercury and the origin of mysterious dark material measured by MESSENGER.
Professor David Paige explains why studying ice on Mercury is important for understanding the origin of life on Earth and the potential habitability of extrasolar planets.
The online version of the print edition (published on January 17, 2013) is available here. And don’t forget to learn how David Paige crafted the cover of Science magazine to showcase the recent MESSENGER discoveries.
Global topographic map of Mars and location of Valles Marineris.
By Ivy S. Carpenter
A giant gash scars the surface of Mars. Known as Valles Marineris, it is one of the largest and most recognizable topographic features in our solar system. Boasting a whopping 4000-km length and a depth ranging from 10 – 15 km, it easily dwarfs Earth’s Grand Canyon (which is a piddling 2 km deep). But despite the distinction of being the longest trough system in the solar system, its origin and formation remain enigmatic.
In a new study selected as Editor’s Choice in the 2012 June 29th issue of Science and to be published in Lithosphere, UCLA’s Professor An Yin suggests that the current structure of the solar system’s ‘grandest canyon’ is a result of left-lateral transtensional faulting, similar to that found in Earth’s Dead Sea fault system.
A three-dimensional structural model for southern Valles Marineris. Notice that the fault zone consists of multiple faults, and the trough bounded on one side by a normal fault and the other side by a strike slip fault. Circles with dots indicate motion toward the viewer, circles with an X indicate motion away from the viewer.
In his model, transtensional deformation (a result of mixed lateral and extensional movement) occurs as a zone of both strike-slip (horizontal ground motion) and normal (vertical motion) faults. The normal faults allow for the subsidence and subsequent infill of a deep trough area, while strike-slip faults offset these sediments and underlying rock.
In a geological mapping tour-de-force, Yin used high-resolution data from NASA’s Mars Reconnaissance Orbiter and Mars Odyssey spacecraft to define the shapes, orientations, and cross-cutting relationships of surface structures such as landslides, erosion, impact features, strata, marker beds and folds in the southern end of the trough.
The results of the mapping effort show impressive trough-parallel left-slip offsets of 150-160 km throughout the Ius-Melas-Coprates fault zone. Offsets are seen clearly where numerous landslide deposits have been displaced sideways by ground motions (see image below). At a larger-scale, Yin identified a continuous, long (>2000 km) and narrow (<50 km) strike-slip zone with >100 km in total slip that appears strikingly similar to the undisputed plate boundary of the Earth’s Dead Sea fault zone. Some local trough-bounding faults may still be active, as they are seen to cut recent surface deposits and landslides.
(A) Image showing two landslides whose channels and fans have been offset by left-lateral strike slip motion. (B) Restored landslide postions after matching up the edges of the channels with their fans.
An alternate interpretation made recently by Jeffrey Andrews-Hannah of the Colorado School of Mines proposes that Marineris is a subsidence feature that formed as a result of the uplift of the nearby Tharsis bulge (see Andrews-Hanna, J.C. 2012., JGR, 117, E06002 at www.agu.org/pubs). However, Andrews-Hannah’s model does not easily account for the physical evidence of horizontal as well as vertical motion in the trough. The scientific debate has already been highlighted by several sources even before Yin’s paper has been published.
Yin’s study raises the fascinating question of why a planet that has supposedly not had plate tectonics for the past 4 billion years should show a feature that looks convincingly like a plate boundary. Vast areas of Valles Marineris, not to mention the other 143,998,500 square kilometers of Mars’ surface, remain imperfectly explored. Accordingly, there remains huge potential for what geological observations may tell us about the structure of this and other planets in the future.
Cinematographer Jon Schwarz behind the scenes of the UCLA SPINLab Educational Film Project.
Spend a day at the ocean or just stop to watch the clouds: there’s ample evidence that the fluid systems around you—the oceans and the atmosphere—are in constant motion. These enormous systems are not only moving and constantly changing, but they’re also capable of undergoing dramatic fluctuations—like hurricanes—that can have profound consequences in our world.
In addition, we also know that human lifestyle is having an impact on the oceans and the atmosphere. From extensive fishing to massive production of carbon dioxide, we are causing significant changes to these systems.
Because we depend on the atmosphere and the oceans—and because we’re becoming increasingly aware of our impact upon them—it’s important to understand how these systems function. At UCLA, we teach a course called “Blue Planet: An introduction to Oceanography.” One of the topics discussed in this course is the large scale fluid dynamics occurring in the oceans and atmosphere. We can create simplified laboratory models of these fluid motions. With funding from UCLA and the National Science Foundation, we devised several small-scale lab experiments and have created a 30 minute film to demonstrate basic fluid motions similar to those occurring in atmospheres and oceans.
In these small-scale experiments, we use water to simulate the fluid dynamics of both the liquid (oceans) and gaseous (atmospheric) envelopes. To simulate the spinning of the earth, we carry out our experiments on a rotating table we have in our lab at UCLA. When we talk about rotating systems—like the earth and most other bodies in the universe—we talk about the Coriolis acceleration. This refers to the way rotation causes a deflection of any moving body, a solid or a liquid, observed within the rotating frame. For each experiment, we begin by looking at our system first without the effects of rotation. Then, we include rotation to see how the behavior of the fluid changes due to the Coriolis accelerations. What you’ll see at the end of this series of experiments is how a planet’s rotation fundamentally influences the large-scale fluid motions of its oceans and atmosphere.
Simulating Jupiter’s “Red Spot” with mechanically forced vortices in a rapidly rotating tank of water
First, we will look at the Coriolis effect with a solid (Chapter 1)—in this case, a ball bearing. Then, we will explore analogs to large-scale atmospheric motions, the atmospheric circulation and the associated wind-belts (Chapter 2, Chapter 3, Chapter 4). Using our model of the wind-belts, we will carry out experiments to understand why large patches of floating garbage are forming near the centers of earth’s ocean basins (Chapter 5). Then, we will carry out experiments with packets of creamer that demonstrate how rapidly rotating fluids behave somewhat like a fluid gyroscope (Chapter 6). Finally, we will carry out experiments to show how swirling motions, called vortices, differ in non-rotating (Chapter 7) and strongly rotating systems (Chapter 8). These last experiments will help us understand the kinds of images we’re now seeing from telescopes and space missions, showing planetary atmospheres in motion.
Our hope is that by viewing these experiments you will develop a sense for how fluids behave both in rotating and non-rotating systems. By noting the differences between the experiments, it should be possible to establish a basis to think about large-scale fluid motions that exist in Earth’s oceans and atmospheres as well as on planets other than Earth.
Videos:
The following videos were filmed in the SPINLab in UCLA’s Department of Earth and Space Sciences. To download movies right click on the download link and select “Save link as”.
Full version
“The Full Monty” (30 min.):
Contains the entire compiled set of experiments, including in-depth explanations of our results and how they relate to geophysical observations.
The Diviner Lunar Radiometer team based at UCLA, played an integral role in the LCROSS experiment – not only did observations from their instrument help in the selection of the impact site, but the data they gathered after impact helped to eventually confirm the presence of water ice in the lunar surface.
LCROSS slammed into the Moon on October 9 2009, in a controlled impact designed to reveal once and for all whether water ice is present beneath its surface. The impact site was situated within a permanently-shadowed part of Cabeus Crater with an average annual temperature of 37 K (-393 °F), making it one of the coldest locations near the lunar south pole. Temperature data from Diviner had played a key role in the selection of Cabeus as the target for LCROSS, and in the lead up to impact, scientists and engineers worked together to ensure that Diviner was able to target the impact site for 8 orbits spaced roughly 2 hours apart, the closest of which passed by 90 seconds after impact.
Brightness in the grayscale image corresponds to surface temperature measured just prior to the LCROSS impact, and the color swath shows temperatures measured about 90 seconds after impact. Credit: Paul Hayne/UCLA/JPL/GSFC/NASA
Recent UCLA graduate Paul Hayne was monitoring the data in real-time as it was sent back from Diviner after the impact.
“During the fly-by 90 seconds after impact, all seven of Diviner’s infrared channels measured an enhanced thermal signal from the crater. The more sensitive of its two solar channels also measured the thermal signal, along with reflected sunlight from the impact plume. Two hours later, the three longest wavelength channels picked up the signal, and after four hours only one channel detected anything above the background temperature.”
Scientists were able to learn two things from these measurements: firstly, they were able to constrain the mass of material that was ejected outwards into space from the impact crater; secondly, they were able to infer the initial temperature and make estimates about the effects of ice in the soil on the observed cooling behavior.
Diviner brightness temperature measurements of the lunar surface near the LCROSS impact site in Cabeus crater. (A) Before and after images of the LCROSS impact site in each of five different Diviner channels, with the thermal emission from the impact circled in the right-hand column, taken approximately 90 seconds after the Centaur impacted the lunar surface. (B) Pre-impact surface temperatures in Cabeus crater recorded by Diviner indicate the LCROSS impact site ('x') was only 40 degrees Celsius above absolute zero just before the impact. Credit: The journal Science.
Given that ice within soil pore spaces influences cooling because it uses up heat energy in the process of sublimating, and conducts heat more efficiently than lunar soil does, scientists were able to use Diviner’s measurements of cooling at the impact site to place constraints on the proportion of volatiles present.
“The fact that heated material was still visible to Diviner after four hours indicates LCROSS did not hit a skating rink – the ice must have been mixed within the soil. We estimate that for an area of 30 to 200 m2, the steaming crater could produce more than enough water vapor to account for what was observed by LCROSS over a four minute period.”
The observations provide strong evidence in support of the theory that there are volatiles ‘cold-trapped’ within permanently-shadowed regions on the Moon. The current thinking is that they were delivered there by impacts from icy bodies which themselves originated in the outer solar system.
The Diviner Lunar Radiometer is one of seven instruments aboard NASA’s Lunar Reconnaissance Orbiter. Principal investigator, David Paige, is a professor in the Department of Earth & Space Sciences at UCLA.
A full text version of the article published in Science can be found here:
Caption: N = principal nucleus, a 120-meter diameter body. AA and BB = cross arms of the “X” structure, though to consist of larger blocks released from the nucleus. C = objects embedded in the “X” arms and detected on more than one date. These are secondary sources of dust for the tail. E = faint extension above the main tail, slightly blended with a smeared, background galaxy. F = filaments of dust released from discrete sources within the “X”. S = Star and background galaxy trails, imperfectly removed from the data.
P/2010 A2 has the orbit of an asteroid but a physical appearance more like a comet. It is one of the “active Asteroids” (or “main-belt comets”) discovered in the last few years. This object was observed at high resolution using the Hubble Space Telescope from January to May 2010, showing subtle changes associated with changes in the viewing geometry. The object shows a point-like nucleus at the leading end that is about 120 meters in diameter. Most likely, this object was struck by a much smaller asteroid, probably just a few meters across, in early 2009. The dispersing remnant, seen in the picture above, includes ribbons and sheets of debris that are pushed away from the sun by the pressure of sunlight. From models of this radiation pressure, we find that the dust particles in the tail range from centimeter size near the nucleus, N, to millimeter size at the far right edge of the picture.
The scientific significance of this object is that it opens the door to real-time study of asteroid disruptions. In the past, we could observe the ancient remnants of past collisions, but had to resort to elaborate models in the context of modern-day collisional evolution of the belt. Collisions are a primary mechanism of asteroid destruction and an important source of dust.
A paper describing the discovery and HST observations is linked here (1 Mb pdf). Pre-discovery observations are linked here (2.8Mb pdf). There is also a stand-alone P/2010 A2 web site.
Soon after P/2010 A2, a second example of likely impact ejection from an asteroid, this time the 100 times larger body (596) Scheila, was discovered by Steve Larson.
Some planets have magnetic fields that act as invisible force fields against the solar wind and the sun’s radiation, called magnetospheres. Although their natural shape is more like a doughnut with the planet at the center, the solar wind is such a strong force that magnetospheres are pulled backwards like a windsock into what we call a magnetotail. The energetic particles carried by the solar wind can sneak into the magnetotail and fill it with energy until an explosive phenomena (“magnetic reconnection”) flings those energetic particles towards the planet. The result is beautiful and dangerous: as the energy hits the planet and creates aurora across the sky, it may also strike orbiting satellites and render them useless. If communication satellites went down at Earth, we could be without GPS and cell phones! I am studying the phenomena that happen when these energetic particles are flung towards a planet in an effort to understand just how they are transported through the magnetotail.
(credit NASA)
http://www.youtube.com/watch?v=l_4tEkwSZhg
(credit SVS/GSFC, J. Raeder/UNH, V. Angelopoulos/UCLA)
Meteor Crater (aka Barringer Crater) is about 1 km in diameter and located an hour’s drive east from Flagstaff, Arizona. Formed 50,000 yrs ago by the impact of an iron-nickel asteroid perhaps 50 meters in diameter. Although seen by Barringer as an iron mining prospect, numerous attempts failed to find a buried iron mass from the impactor. We now know that this is because the impact was at a speed high enough to vaporize the projectile as well as a large mass of the target sandstones, causing the crater-forming explosion. Only small fragments of the projectile have been located.
Meteor Crater is especially important in planetary science as it is the prototype structure on which the essential features of craters, generally, were worked out by Gene Shoemaker. Diagnostics of impact include highly shocked minerals (which can only form at pressures created in cosmic impacts) in the crater floor, shatter cones, and an over-turned rim-flap (caused by folding of the pre-impact strata by the blast, a bit like the petals of a giant flower unfolding as they open).
Although small, the impact was no doubt locally devastating to the surrounding plants and animals, showering the environs with hypervelocity rock and metal shrapnel and killing everything for 10’s of kilometers around. The crater is about 200 times smaller than the one responsible for the KT extinction 65 Myr ago. The projectile was similar in size to the one that caused an airburst above Siberia in 1906, but being of iron (instead of stone or ice) was able to deposit its energy into the ground).